Cost of Quality and C3
Chapter 24 from Mastering Excellence: A Leader’s Guide to Aligning Strategy, Culture, Customer Experience & Measures of Success
Written by Douglas Wood
How many managers would be pleased with a return on investment of eight to one? In other words, investing $125,000 and gaining a $1,000,000 return? The technique is not a high-risk one; it is an approach that has been applied for thirty-five years. It is called “cost of quality.”
Cost of Quality or Quality Costs Defined
“Quality costs represent the difference between the actual cost to produce a product or service and what the reduced cost would be if there were no possibility of inadequate or defective products, or defects in their manufacture.”
This definition does not include the cost of doing it right the first time. That is the cost of doing business. In other words, cost of quality counts the unusual activities, not the usual ones.
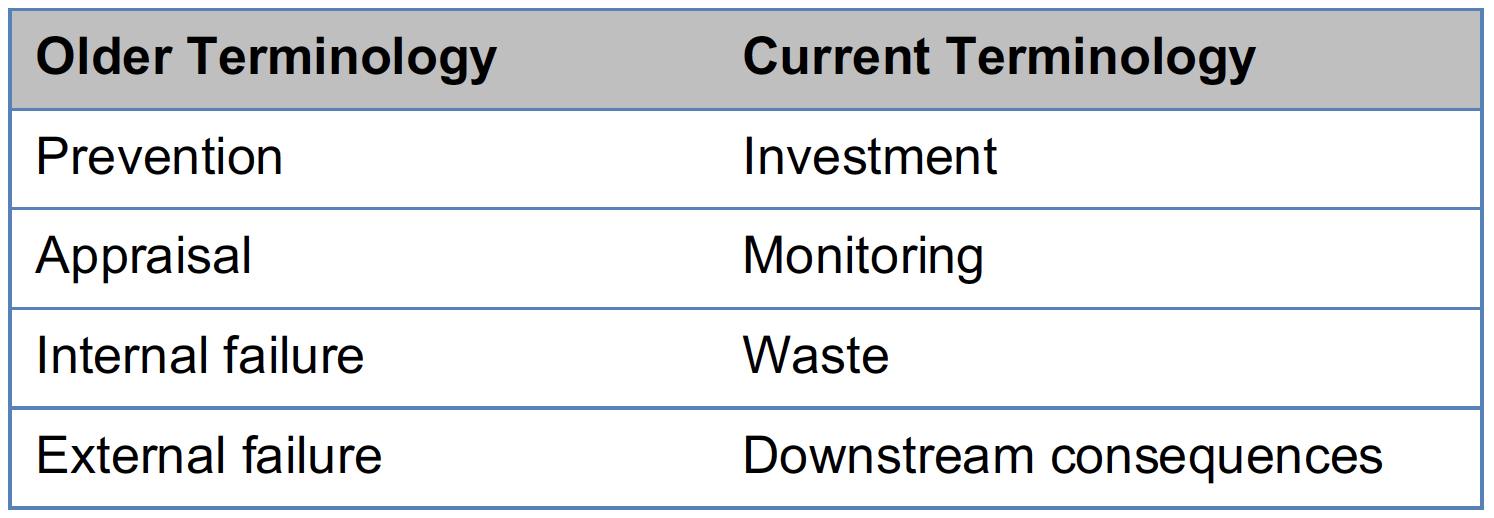
Quality costs are broken down into four categories: prevention, appraisal, internal failure, and external failure. While this terminology reflects the language of thirty years ago, better labels describing these four categories in today’s terms are investment, monitoring, waste, and downstream consequences.

Douglas Wood
DC Wood Consulting, Fairway, KS 66205
Prevention Costs Are Investments
“The costs of all activities specifically designed to prevent poor quality in products or services.”
In this category, we keep the focus on activities that are associated with designing, installing, and maintaining plans of control. This category of quality cost is usually small relative to downstream wastes. Almost all design activities may be related to prevention unless they are redesigning something that was done poorly the first time. Redesign is considered waste.
Appraisal Costs Monitor Expenses
“Costs associated with measuring, evaluating, or auditing products or services to assure conformance to quality standards and performance requirements.”
In this category, we focus on assuring conformance by the measurement of process quality and product quality. Conformance is meeting the standard. While these costs may be larger or smaller depending on the sophistication of the organization and the complexity of the workflow, these are necessary expenditures to know what is happening in the processes. As controls become embedded in the processes, there may be less need for these monitoring activities.
Internal Failure Costs Are Waste
“Failure costs occurring prior to delivery or shipment of the product, or the furnishing of a service, to the customer.”
Any cost that does not reflect value added to the customer can be considered waste. We break the waste costs into “before delivery” and “after delivery” as a way to identify approaches to reducing them. C3 focuses directly on the quality of process as demonstrated by products in the eye of the customer. A process that does not produce something the customer wishes is a poor-quality process and likely to be fraught with waste. Put another way, a product not wanted by a customer is a waste, as is the process that created and delivered it.
External Failure Costs Are Downstream Consequences
“Failure costs occurring after delivery or shipment of the product, and during or after furnishing of a service, to the customer”
The newer phrase, downstream consequences, helps by showing that these problems go beyond the immediate experience when the product is delivered. To sort out an organization’s costs into these new categories may seem difficult, but the next figure makes it a straightforward process.
With these definitions, we begin to see that cost of quality is more than “poor quality cost” and more than just finding defects. It is proactive by seeking to place preventative investments and monitoring activities in place as “good quality costs.” Measuring only wastes and downstream consequences (internal and external failure costs) is like steering a ship by watching the wake.

The Core Principle Of Quality Costs
Now we can substantiate the eight-to-one ROI statement: the core principle of quality costs is that investing a relatively small amount of money in prevention produces a large reduction in cost of failure and eventually a reduction in cost of appraisal.
Most organizations are not spending enough on prevention and design. Well-run organizations today often display a proportion of quality costs between prevention: appraisal: failure of $1:$4:$9. That is, each dollar of prevention is matched by $4 of appraisal and $9 of failure or waste. Organizations with greater difficulties may see this proportion as $1:$5:$30, even $50. In a 2005 study,127 the self-identified average cost of quality (P, A, and F) was found to be approximately 6 percent of revenue. The population of organizations in this study were already measuring cost of quality, so presumably had been working for some time to reduce it. Other firms who do not measure it are likely to have a higher cost of quality relative to their revenue.
I have a further note on ROI. On average, the increase in prevention expense drives a reduction of failure cost in the proportion of $1:$8 within one year. Of course, the added prevention expense needs to be invested in the areas of significant failure expense.
You can see by these proportions that there is ample opportunity even in an already well-run organization to reduce costs by placing investments (more prevention expense) in the proper places. Finding the proper places is difficult. C3 provides a framework for identifying the proper prevention investments to drive out waste.
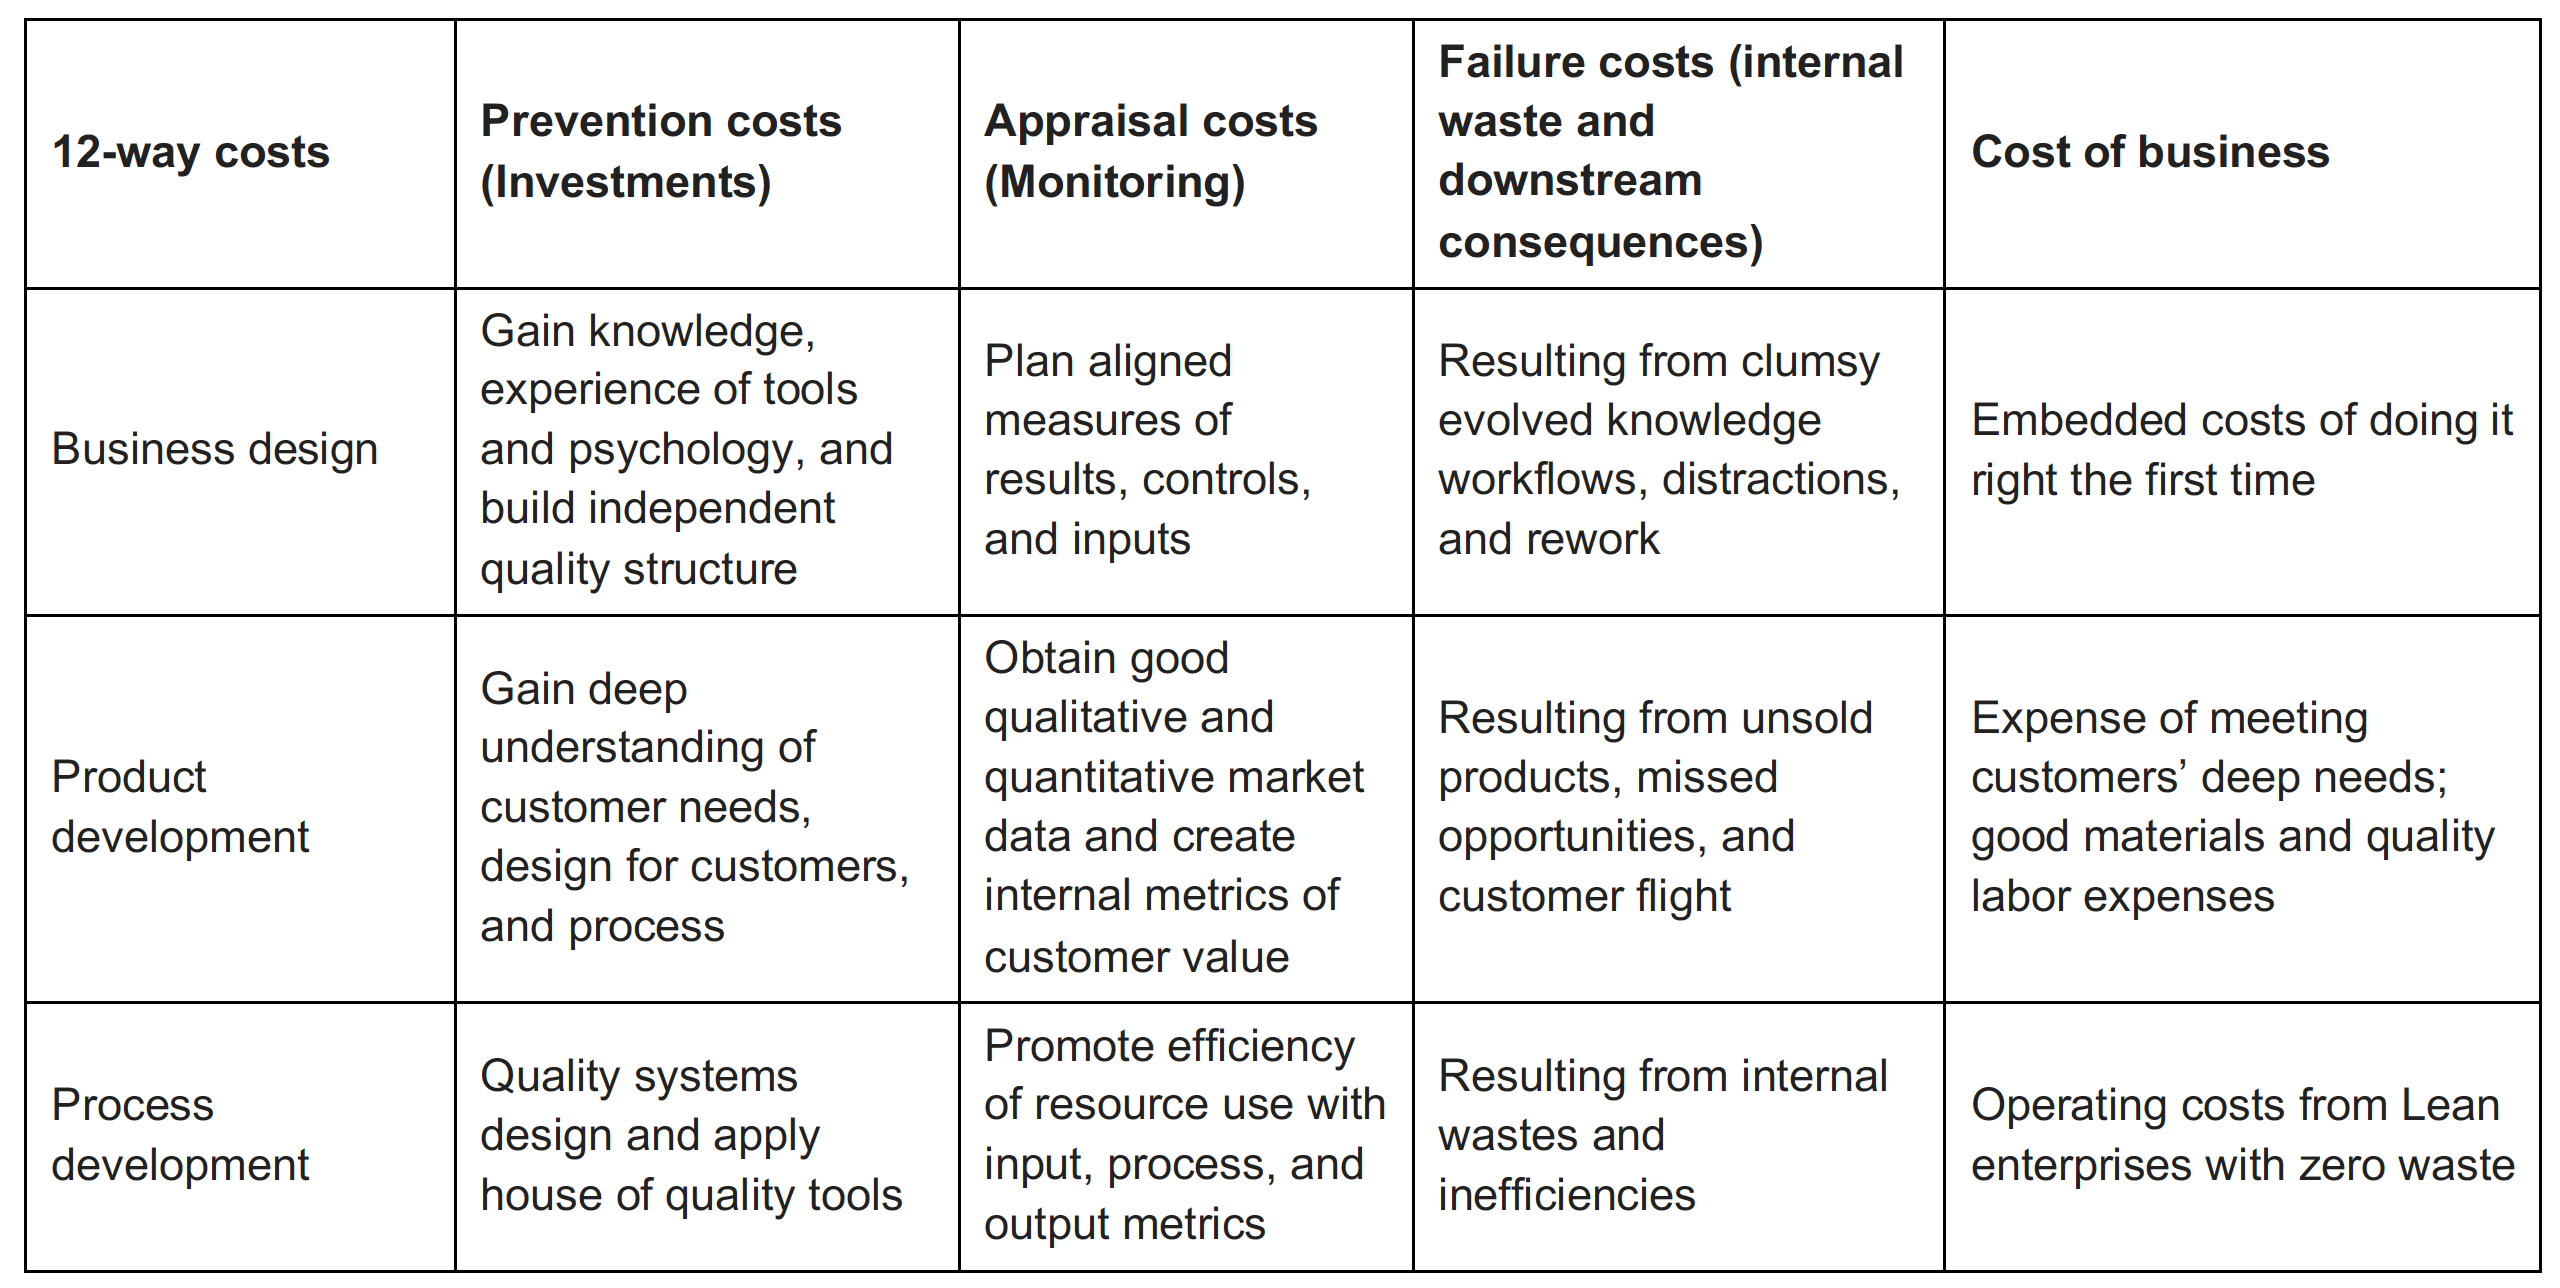
C3 looks at three activities that need to occur in order for an organization to truly excel. First, the business needs to be designed in a specific manner to be able to achieve both product and process excellence based on customer needs. We may call these three activities business design, product development, and process development.
The elements of cost of quality can be found in each of these three activities. If we build a matrix to show these and include descriptions of the contents, it may look like the next figure.
The Language of Money
The cost categories above are almost never seen in cost accounting or common management reporting schemes. Many improvement programs measure process characteristics to demonstrate improvement. Lean programs typically measure cycle-time reduction; Six Sigma programs measure defects per million opportunities.
While many process characteristics could be used as an overall metric of improvement, the above cost measures have one significant benefit compared to the others. All strategic planning involves money: costs, investments, ROI, increased revenue, and decreased costs. If you can’t measure it in dollar terms, it is not strategic! Without measuring dollars, you are not speaking the language of leadership, either for profit-based organizations or not-for-profit organizations.
Leadership makes the choice of which action plans will best carry out strategy by measuring ROI. Resources are allocated to the most important areas and top priorities by looking at the planned ROI. Whether or not a strategic plan is successful will be measured via ROI. This is what makes quality cost the strategic measure of improvement. Consider two kinds of ROI: to design a product customers love
and to fix a product they don’t. The first reflects an increase of money coming in to the enterprise; the second involves reducing money going out. This is one way to understand the two sides of the money coin both C3 and COQ seek to give the well-run enterprise.
C3 and quality cost both focus on alignment with the organization’s strategy. No improvement program will succeed unless the senior levels of an organization are behind the key drivers of implementation. Time is limited, so what is most important is to be dealt with first. This alignment is shown best by using the language of money.
Purposes of Cost of Quality and C3
Cost of quality has three primary purposes: (1) guide improvement programs, (2) raise awareness of the strategic nature of quality management, and (3) calculate the ROI of improvement programs. All three of these purposes are focused on change and improvement. These three purposes are relatively narrow and focused. This suggests they have a specific aim and are best for focused situations.
C3 has a broader and more simply stated purpose— to link customer needs to products and business processes. A broader purpose makes it a more powerful tool applicable in many areas of human work. Quality cost is a more focused tool, suitable for use within a broader C3 framework. Cost of quality thinking is procedural, and C3 thinking is transformational. In addition, C3 expressly targets knowledge products, making its application potential universal and weighted to work upstream from any delivered product, whether manufactured or not. Since every manufactured or sold product is at the end of a stream of knowledge products, C3 has a powerful effect on all the products that could contribute to final product excellence.
The Constraint of Inertia
Why don’t more organizations embrace these concepts? Simply put, everyone likes to think things are going well now, they are a successful organization simply due to profitability or meeting their budget, and rocking the boat is uncomfortable. Just look at measuring the cost of all waste and downstream consequences. Would you want your cost of failure made public? Would you share it with the board of directors without them asking for it? If you have a publicly held organization, how would your shareholders react if they knew 6 to 10 percent of your revenue was spent on waste?
The best argument to measuring the cost of quality is how it will pinpoint process weaknesses while measuring the investments to fix these issues. You do not have to share these figures with shareholders or outsiders. Most firms will not share, as they consider cost of quality a competitive advantage tool.
C3 is like cost of quality in that few know about it to embrace it, but those who do see it as invaluable. C3 helps to find the pain points in product delivery from concept to customer acquisition. Cost of quality looks at internal processes, optimizing resource allocation.
No process improvement effort is ideal without taking into account the humans who direct and execute the processes of the organization. Cost of quality may be prone to missing this human element since it focuses on monetary metrics. At its core, C3 is a human-centric approach, starting with the customer and his or her needs. This focus may prevent a misapplication of approaches, avoiding alienation of the people we rely on to make our organizations succeed. Consider the fact that everybody wants improvements but no one likes to have improvement done to him or her.
What to Do
Cost of quality assumes that the process to produce the product has been designed. What is a designed process? It is one where thought has been applied to the overall flow as well as the various steps in the flow. The entire flow is optimized for overall efficiency (use of resources) and effectiveness (applicability of output to end users or customers). C3 helps with this design. It starts by describing a flow of products. This flow of products describes a process. By obtaining and using a careful description of results expected from and characteristics of products to be used by customers, C3 proceeds to the receipt of that product by the customer.
Stream-based process thinking is uncommon with knowledge work in many industries such as in financial- services and health-care delivery. Both of these industries are ripe for change and exhibit significant and costly wastes in their present form. Both of these industries also resist change for improved customer quality. But what is end-to-end process thinking?
End-To-End Process Design
There is significant waste in most office work systems. (Think of poor meetings, bad workflow, communications waste such as email overkill, distractions, and lack of engagement.) It is tempting to accept these negatives as simply our lot in life within complex organizations. Resist that temptation and examine the overriding cause. Much of the waste in offices is due to nondesigned systems. These office systems have evolved over time. Unlike offices, factories use mechanical/electrical/industrial engineers to design their work systems. Who designs the work system in offices? Most likely no one, but if there is an office manager who has designed the workflow, do they have an equivalent education to the plant engineers? There is rarely the same rigor applied in office work design.
The waste in office environments is partly due to not having clear and useful product specifications. In a factory, the design of the work process uses product specifications as rigid guides. How can office work be designed well if the products have missing or weak specifications?
Furthermore, product specifications must be based on customer needs, not on past practice. If the design does not start with insight of customer needs at sufficient depth and precision, the specifications will be weak, the process will be sloppy, and waste will run rampant.
Many firms are seeking to automate their office work process. But what kind of flow is being designed? Simply buying a packaged flow is unlikely to fit every office situation. And few packages address the product specification issue from the customer’s view. Most office work requires a larger portion of flexibility than factory work, so prepackaged solutions are likely to be rigid and not robust.
One example is that of automated pharmacy refills. The phone rings, and you get a recorded voice telling you that your refill is due, but your prescription is out of refills, and there may be a delay while the pharmacist gets your doctor to send in a new one. If you are changing doctors or locations, you don’t get the chance to talk to someone and make the fixes right away. Such an automated system is unlikely to allow for special situations, such as you are on vacation and so on. No one asked you what kind of service product you would like.
Many of our more mature manufacturing industries have long understood that someone needs to design the process. Furthermore, someone needs to supervise and maintain the end-to-end process. Financial, health care, and other knowledge industries (mentioned above) also lag in the effective application of quality cost principles. A big contributor to this situation is the fact that such industries do not generally think of their work as definable products. This is even more pronounced regarding products created for strictly internal use. Application of C3 facilitates creating an end-to-end process that is effective; cost of quality is a tool designed to help with maintenance and efficiency.
Successful applications of quality cost have been within a framework where end-to-end process management is well understood. Industries where end-to-end process design and management is not commonplace will have a hard time applying or visualizing the value of cost of quality. By beginning with a flow model describing the relationships of all relevant products, C3 enables visualization of the end-to end process. This may be needed before a cost of quality metric is contemplated.
Good work processes do not just happen; they are designed. Sometimes they’re not designed well. Sometimes a design looks good on paper but does not actually work well. We know what happens when we begin work without a design and a design without customer specifications. There will be significant confusion, ambiguity, and waste. In new situations or processes, we are often tempted to live with this confusion, ambiguity, and waste. But there is no reason when dealing with existing and well-defined processes that we should live with these problems.
C3 helps with end-to-end flow design by providing customer-based guidelines. Even if the customer does not know or need to know the internal work processes, those designing the internal processes need to know exactly what the customer expects in the product and how the process impacts that product.
Let’s set up an example to illustrate cost of quality in a flow situation. Department A passes its product to department B. A measures their waste and monitoring expense and begins prevention efforts to improve their cost of quality. With this investment, A reduces internal defects. Department B may see little change if department A has been routinely monitoring and doing rework (waste), not passing these defects downstream. The quality costs generated in department A have improved. B has no reason to be concerned with this aspect of their supplier department, A, unless a few defects occasionally have sneaked by department A’s rigorous cleanup squad.
When allocating resources across all departments for improvement projects, a comparison of quality costs between department A and department B is invaluable. Allocating equal investment for unequal waste is another waste. This example shows how quality costs may support overall efforts even if issues are mostly contained to local organizational units. Of course, waste may spill downstream when a
deficiency is not completely remedied, increasing the importance of a higher-level cost of quality measure. If wastes leave department A, the causes in A need to be related to effects in department B.
C3 and quality cost start at different ends of the workflow. C3 starts with a customer perspective and moves back up the supply chain. C3 links diverse organizational silos with the overarching needs of the customer. Quality costs start inside and focus on metrics of waste, monitoring, and investment for prevention. These two approaches complement each other, providing multidimensional drivers of
improvement.
Quality costs take an insider view of the organization and measure cause and effects of waste. This may result in a relatively negative view, exaggerating the misconception of quality personnel as police or continual naysayers. The ability of quality personnel to identify issues before they are apparent to customers is critical, but this ability can be discounted when more influential personnel in the organization see quality in a negative light. This issue is exaggerated when quality is understood by influential personnel as “catching things gone wrong.”
C3 takes an outsider approach to the organization and helps to bring to light aspects that may not be evident to operational personnel and leadership. C3 is a more positive approach, one that emphasizes the better way to align the organization with customer desires.
How Large Is Office Waste?
A recent study128 has shown the average total dollar cost of office waste to be over $17,000 per person per year. With thirty-five people in an office, that is over a half-million dollars each year. Just like in the case with factory cost of quality at 6 percent of revenue, the actual costs are staggering. This total office waste breaks down into major categories of poor workflow, messaging issues (phone calls, emails, and instant messaging), distractions, and motivation issues. Much of this is due to poor work design, unclear product specifications, and missing insights of customer need.
C3 and Cost of Quality: Two Approaches That Complement Each Other
There is much to gain by combining these two approaches. First, C3 helps make sure the customer needs (via outcomes and products) drive the internal process. All quality processes and products start with the customer. Second, C3 and quality cost differ in pacing. In today’s culture we seek fast answers.
It is not always the best product that wins the race to acceptance, but often the fastest one. C3 emphasizes fast action using rules to ensure effective results. Quality cost is a slow-thinking tool. It is formulated by teams and implemented in stages. To make a difference, quality-cost measures often take months. C3 can produce results much more quickly.
Change can come quickly and slowly. C3 has repeatedly shown that change can occur faster than expected. Quality costs suggest a slower pace is necessary, one that uses tracked expenses to understand the degree of change process improvers have actually implemented in organizational processes. Also cost of quality tends to focus on specific situations, while C3 seeks to address broader cultural issues wherever a customer is involved. The scope of the two approaches is quite different, like using a fishing rod versus a net. Some change is needed quickly, or employees will tire of the effort. At the same time, keeping the effort in place needs a sustaining hand. C3 can make initial change felt, and quality costs can provide a longer term strategic change driver.
Quality costs are focused on accounting and numeric measures and start with the idea that metrics guide behavior. To get behavior A, you need to show the costs of B and C. Quality-cost measures assume that by measuring a thing, improvements will occur. This requires that fact-based improvement thinking be in place in an organization. You measure the costs using selected categories, read the ratios, make comparisons over time, and use these measures to drive decisions. We assume that quality costs are focused on what is important and designed to achieve the best results. This is analytical thinking.
Of course, there is also creative thinking. C3 provides a framework for productive application of creativity and innovation.
Summary
- Cost of quality can create a measure of the ROI for improvement. Large financial improvements are possible, even for organizations for which high expenses do not appear to be a problem.
- Cost of quality is an underutilized tool for alignment of improvement efforts.
- The size of quality costs may be painful to face, especially in a profitable organization.
- Cost of quality uses the language of leadership, the language of strategy, and the language of money.
- C3 and cost of quality have different purposes. Cost of quality is narrower and internally focused and primarily looks at efficiency. C3 is broader and more externally focused (at least at the start) and primarily drives effectiveness.
- A designed work process is essential to measure cost of quality, and C3 will make for a good process design.
- C3 and cost of quality complement each other. Cost of quality is a fishing rod-like tool, and C3 is a broader cultural, net-like system.